Variation I:
In graph we took the example of Salary versus employees. Lets go ahead and extend the same example to add commission to the graph to show something like:
In the graph above red bar displays the commission too along with this. To achieve we can add one more attribute to the View Object acting as the source for this graph and sql for the vo could look like this:
Select Ename, Sal, comm from EMP
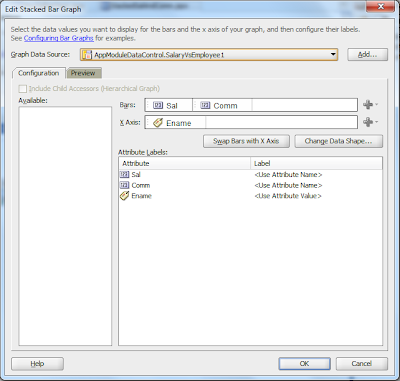
Now we can either edit the Map binding on the page binding to add the commission attribute (comm in this case) to the Bars column or you can delete the old map and drag and drop the view object from data control as Graph (steps are same as mention in the Part I of this blog except addition of commission attribute as shown below).
Variation II:
In the above graph Salary and commission are shown as two seperate bars we can combine them in one bar as below:
To achieve this just select Stacked Bar as the Graph Type and rest remains the same:


No comments:
Post a Comment